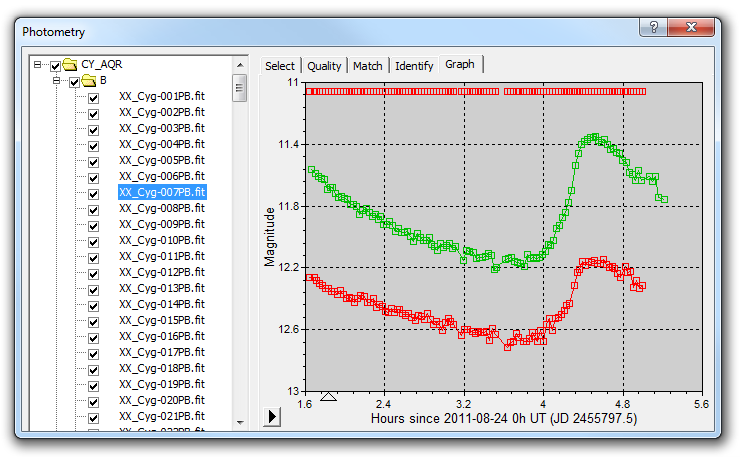
When you select the Graph Tab the window will automatically resize, since usually you need more room for the graph (the Graph tab and the other tabs are resizable by dragging the edge or the corners with the mouse).
Once the analysis is complete A graph will be displayed showing the light curves of the tagged objects. Each object will have a separate curve with different markers or colors.
You can adjust various graph settings as follows:
Right-click on the Magnitude (Y) axis to adjust vertical scaling.
You can select Auto to include all data on the graph.
You can also adjust the Faintest and Brightest values, which correspond to the bottom and the top of the graph, respectively.
Right-click on the Time (X) axis to adjust horizontal scaling.
Auto will automatically scale the graph to include all data.
The Base Time is used as the basis for the horizontal axis; all displayed times are relative to that base. This value also controls the phase offset for period folding. You can set the basis for the axis by selecting Base Time. You will be prompted to enter Universal Time.
You can set the minimum time displayed by selecting Minimum.
You can set the maximum time displayed by selecting Maximum.
You can control period folding, which is used to overlay successive cycles of a periodic variable star.
Period Folding Off disables period folding.
Period in Hours lets you specify period folding in hours.
Period in Days lets you specify period folding in decimal days.
Right-click on the graph itself to select which lines appear.
Right-click on a line to:
Hide it by unchecking the name (restore by right-clicking on the graph)
Set the Symbol for each data point to None, Square, Circle, Triangle, Inv. Triangle, Diamond, Plus, or Point. You can also set the Size and Color of the points. These are unique to each line.
Set the Line formatting to None, Thin, Medium, Heavy, Dashed, or Dotted. You can also set the Color.
Objects lets you set which data are plotted.
You can also easily inspect the image for each data point by clicking on it. The image will be selected in the tree view, and the image will be displayed. If you decide that an image is of poor quality you can remove it from the graph by unchecking the image in the tree view. You can check or uncheck multiple images by selecting them using SHIFT or CTRL click and using the right-click menu.
Data Export and Printing
The ![]() Options menu at the bottom of the graph allows you to export and print measurements.
Options menu at the bottom of the graph allows you to export and print measurements.
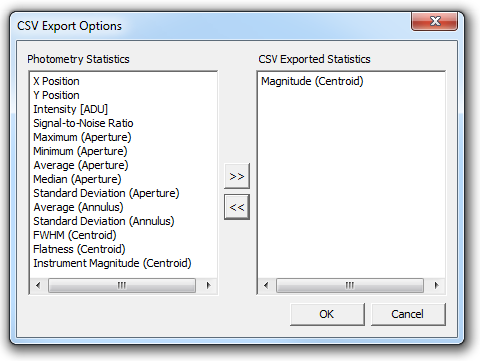
CSV Export Options controls what data is saved to CSV files. CSV exports are fully configurable, and can include both photometry measurement data and other general-purpose measurements. The available options are:
Magnitude (centroid) - magnitude of the object at the centroid location. Cannot be disabled.
X Position - X position of the object.
Y Position - Y position of the object.
Intensity (ADU) - raw measurement of the object intensity in ADU.
Signal-to-Noise Ratio - estimate of the SNR of the measurement.
Maximum (Aperture) - maximum ADU value inside the aperture.
Minimum (Aperture) - minimum ADU value inside the aperture.
Average (Aperture) - average ADU value inside the aperture.
Median (Aperture) - median ADU value inside the aperture.
Standard Deviation (Aperture) - standard deviation of the ADU values inside the aperture.
Average (Annulus) - average ADU value inside the annulus.
Standard Deviation (Annulus) - standard deviation of the ADU value inside the annulus.
FWHM (Centroid) - Full Width Half Maximum of the object at the centroid location.
Flatness (Centroid) - Flatness of the object at the centroid location (e.g. autoguider error)
Instrument Magnitude (Centroid) - instrumental magnitude of the object at the centroid location.
Note: "Aperture" means as measured within the aperture defined by the graphical tag on the image. "Annulus" means as measured within the annulus defined by the graphical tag on the image. "Centroid" means the aperture was adjusted to be precisely centered on the centroid of the star prior to making the measurement.
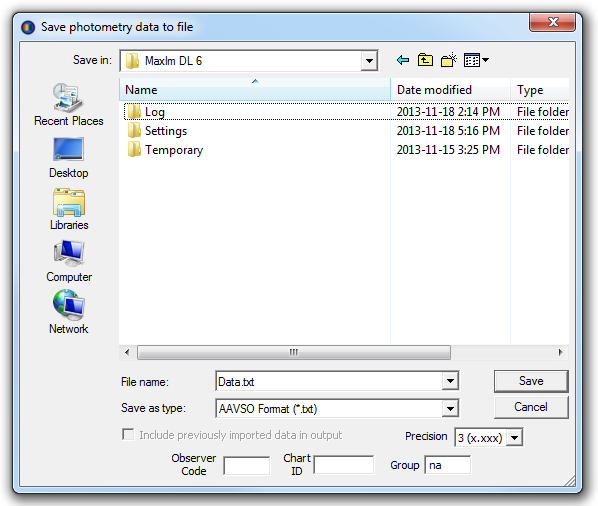
The Save CSV and Save AAVSO items allow you to save photometry measurements to disk. You can browse to the desired folder and enter a File name. You can select Save as type to either Comma Separated Values (*.csv) or AAVSO Format (*.txt). If AAVSO is selected, then additional fields are enabled: Observer Code, Chart ID, and Group. Please consult with AAVSO documentation on how to set these fields. In CSV mode, if you have imported previously analyzed data you have the option to include that in your output. For both formats you can also control the Precision of the exported data.
The Print menu item brings up the standard Windows print dialog box. This allows you to print the graph.