Pseudo Color creates false color images from monochrome or color images. Ten different schemes can be set up using the Color Scheme selector. To name a scheme, just type in the Color Scheme field.
Availability of this feature depends on Product Level.
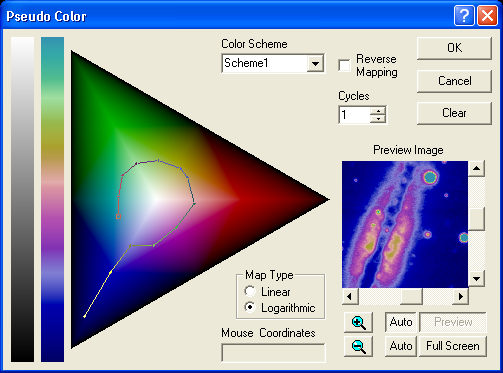
At left are two color bars that form the translation index. The gray levels (left bar) correspond to brightness levels in the selected image. These are based on the current screen stretch settings; changing the screen stretch on the selected image will change the effect of the processing (Note: you can adjust the screen stretch of an image while this dialog box is open if you first select the image with the mouse).
The right hand bar indicates what color the corresponding gray shade will be translated into. The color scheme in this bar is created by drawing a line on the triangular color map. The color map shows a "gamut" of color levels.
To draw a new color scheme, select the desired slot in Color Scheme, and click the Clear button if necessary to remove any previous lines. Click once on the map on a color which you wish to correspond to black (the exact red, green, and blue coordinates in color space are shown under Mouse Coordinates). To set the point corresponding to white (maximum brightness), click a second point. A line will be drawn between the two points, and the color translation bar will be updated. If the Auto Preview check box is on, the Preview Image will show what the final image will look like (to reposition the preview image, drag it while holding down the right mouse button).
As an exercise, start by clicking on the rightmost point in the triangle, then move to the brightest red color (about half-way to the center) and click again. Make sure Cycles is set to 1. The image will be converted from gray scale to shades of red.
You can add a third point by clicking again on another color. Additional points can also be added; a line will connect the new point with the one that was previously placed. If you wish to move a placed point, position the mouse over it, hold down the left mouse button, and drag it to a new location. You can also delete a point by right-clicking on it.
The map can take on different styles, designed to shift the range of colors in the gamut. The Logarithmic mode shows more cyan, yellow, and magenta shades. The Linear mode produces linear color changes along a straight line.
You can reverse the order of the colors by turning on Reverse Mapping. You can change the number of times the colors repeat by adjusting the Cycles control; for example, setting Cycles to 2 will make the color scheme repeat twice. This control can be used to generate the appearance of a contour map.