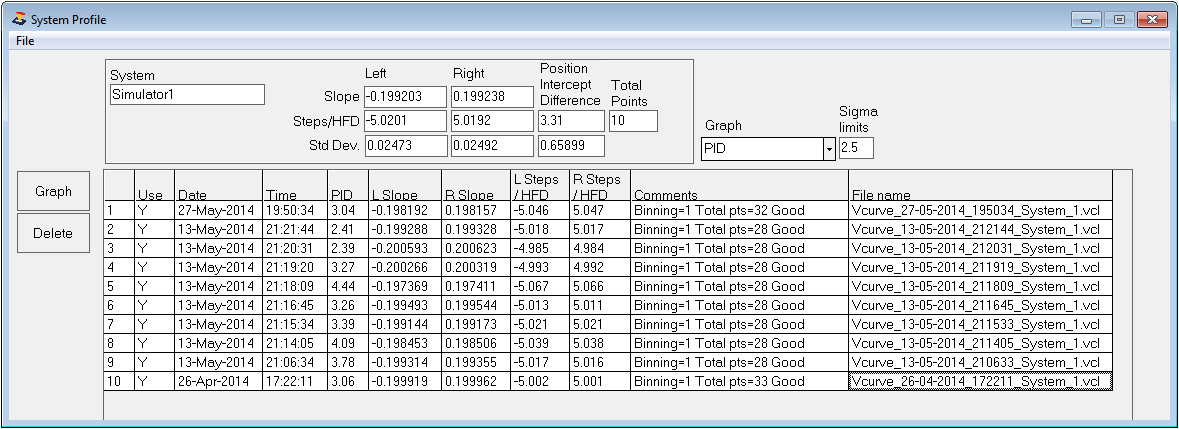
This window contains the results of the Vcurve runs that characterize your system.
These parameters are the heart of the FocusMax algorithm and are unique for each system configuration.
If you change a camera, focuser, add a device such as filter wheel or rotator, then a new PRofile should be created with a unique name so that the system parameters may be saved and loaded when you wish to focus the telescope.
|
Shows the summary information of the detailed data saved in the bottom section.
 Left Slope defined as the slope of the best-fit line for the left side of the Vcurve,
Right Slope defined as the slope of the best-fit line for the right side of the Vcurve
Steps / HFD is 1/slope
Position Intercept Difference is defined as the number of focuser steps measured between the left and the right lines where they intercept the horizontal axis (the axis where HFD =0)
Total Points are the number of data points used to calculate the average slope and PID
The First Column can be clicked to highlight a single row or a series of rows that may then be deleted when the Delete Records button is clicked.
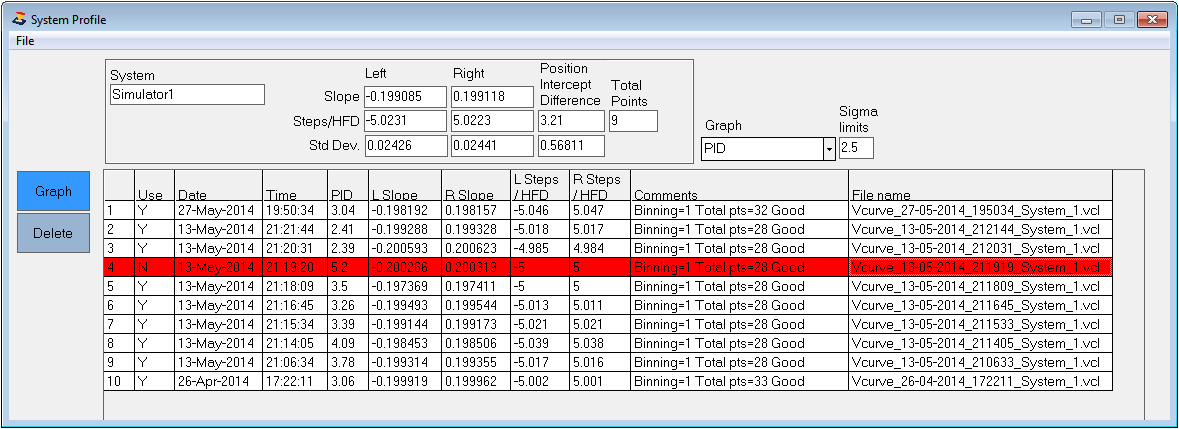
The Use column can be toggled from Yes to No, or No to Yes by clicking on the cell. This will automatically include or exclude data which will update the Profile results shown in the upper part of the window.
The Date and Time when the Vcurve was saved to the System Profile. The rows are sorted with more recent data toward the top.
Position Intercept Difference defined above.
Left Slope & Right Slope of the Vcurve best-fit lines.
Useful information is logged into the Comments column which is useful for identifying rows to exclude.
The information is easily edited by double clicking on the desired cell and entering the new information in the pop-up box. The update will be saved to the System ini Files when the System Profile window is closed. You can increase or decrease the size of the lower section by simply dragging the lower edge of the System Profile window. All changes made in the grid are immediately averaged and reflected to the upper section data.
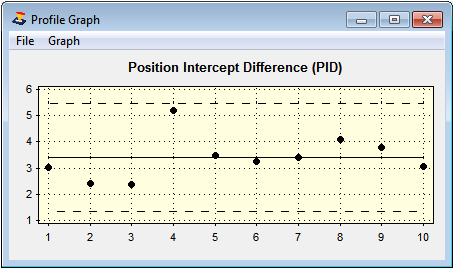
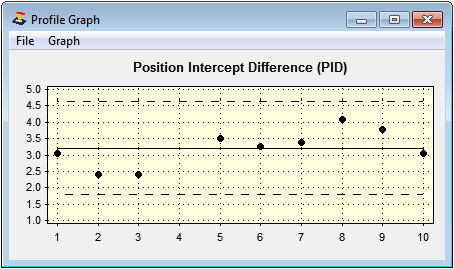
You can select and display the Vcurve data in a graph.
The Sigma Limits setting in the Profile Window will allow you to identify Vcurve data that is errant or suspect.
Note in the picture below that reading number 4 is at or slightly beyond the dashed Sigma Limit lines and can be considered a suspect data point. This can easily be excluded form the analysis by double clicking the 'Y' on data point #4 in the data grid which will toggle the 'Y' to 'N'' and automatically update the graph.
These three characterization parameters are automatically saved to the active System and will be used by FocusMax during an for autofocus run.
|
To delete Vcurve data Click the far left row number which will highlight the row(s) to delete then press the Delete button.
|