The Focus Plot shows the focus position readings during the autofocus run
The Focus Plot shows the focus position readings during the autofocus run
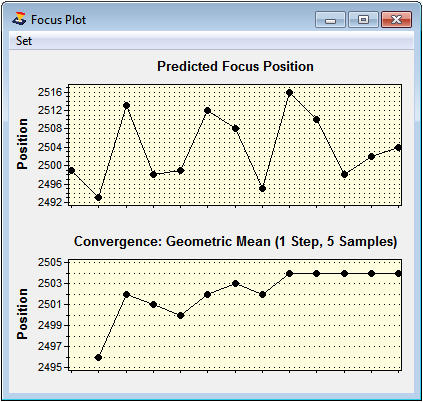
 The top graph shows the Predicted Focus Position for each sub-frame image taken during the autofocus run. This is a single position estimate for each subframe image and is useful for displaying the variation due to seeing conditions.
The bottom graph shows the calculated focus position progress. If the Focus Convergence feature is enabled in Preferences then the plot will show how the focus position is converging.
|
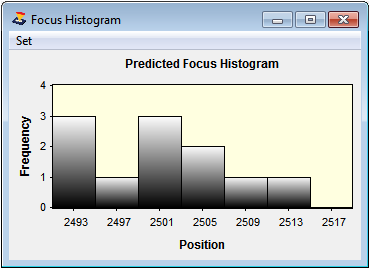
shows the occurrences of number of predicted predicted focus position and is useful as a measure of displaying seeing variation
|